Readings in your daily notes, with a chart
Weigh in, read the electricity meter, note how far you ran: in tagwerk a reading is simply part of the line.
Weighed myself #weight:81.4
Power meter #power:473574
Ran in the rain #run:7.2 km
The tag stays the same tag, the value behind the colon is the reading for that day. Numbers can use a point or a comma. Words like #feeling:good are counted instead of averaged.
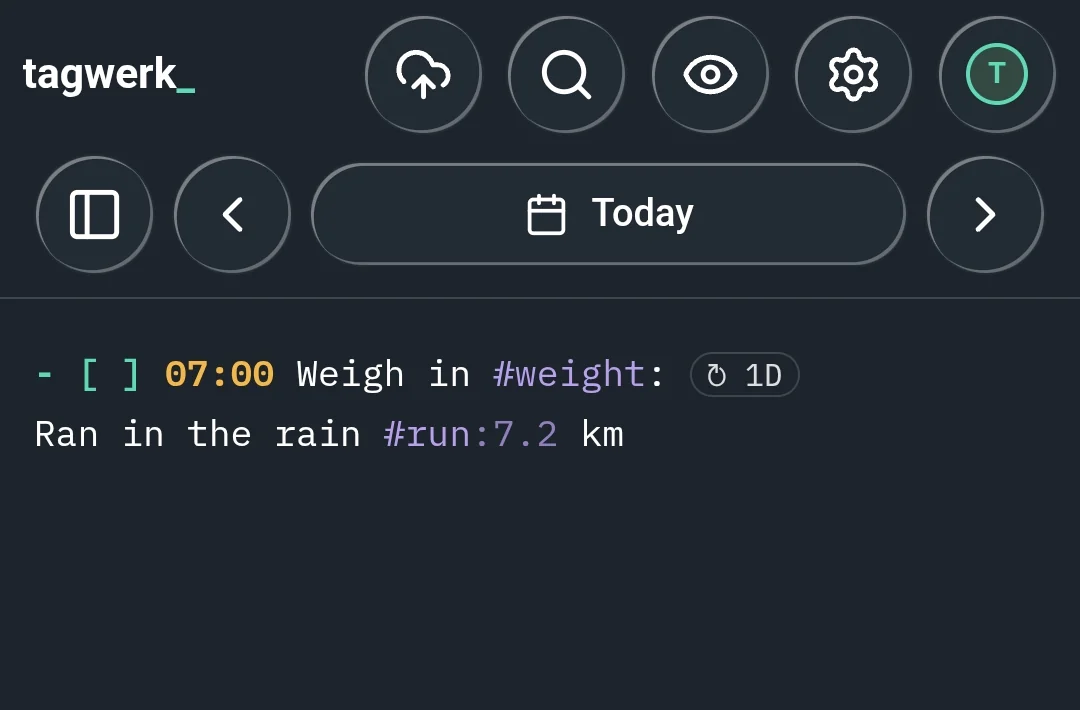
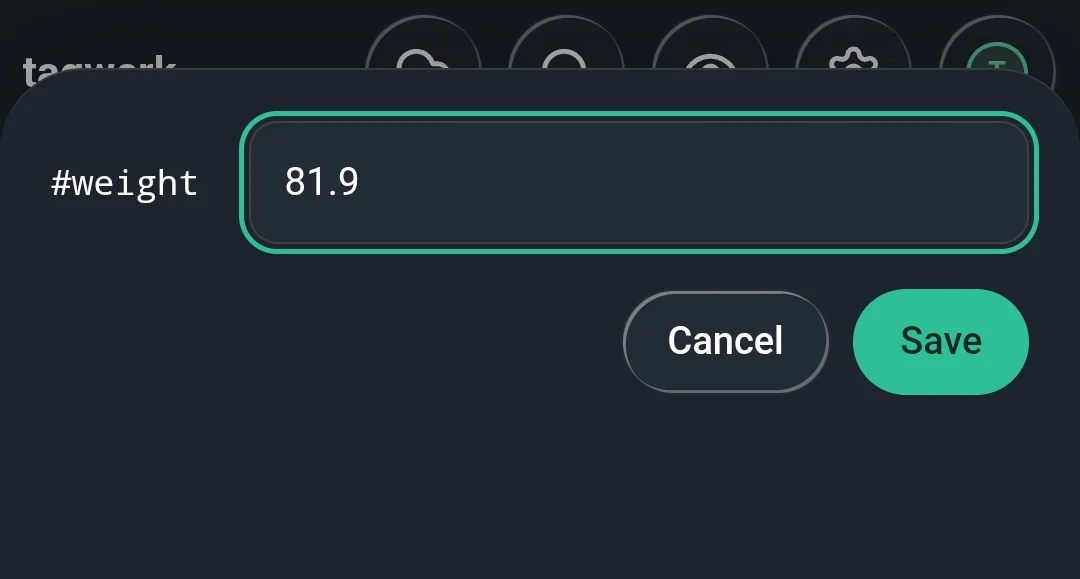
For a habit you can leave the value open. A task like - [ ] 07:00 Weigh in #weight: waits for its reading, and when you tick it off, tagwerk asks for the value and writes it into the line. The field shows your last value as a hint.
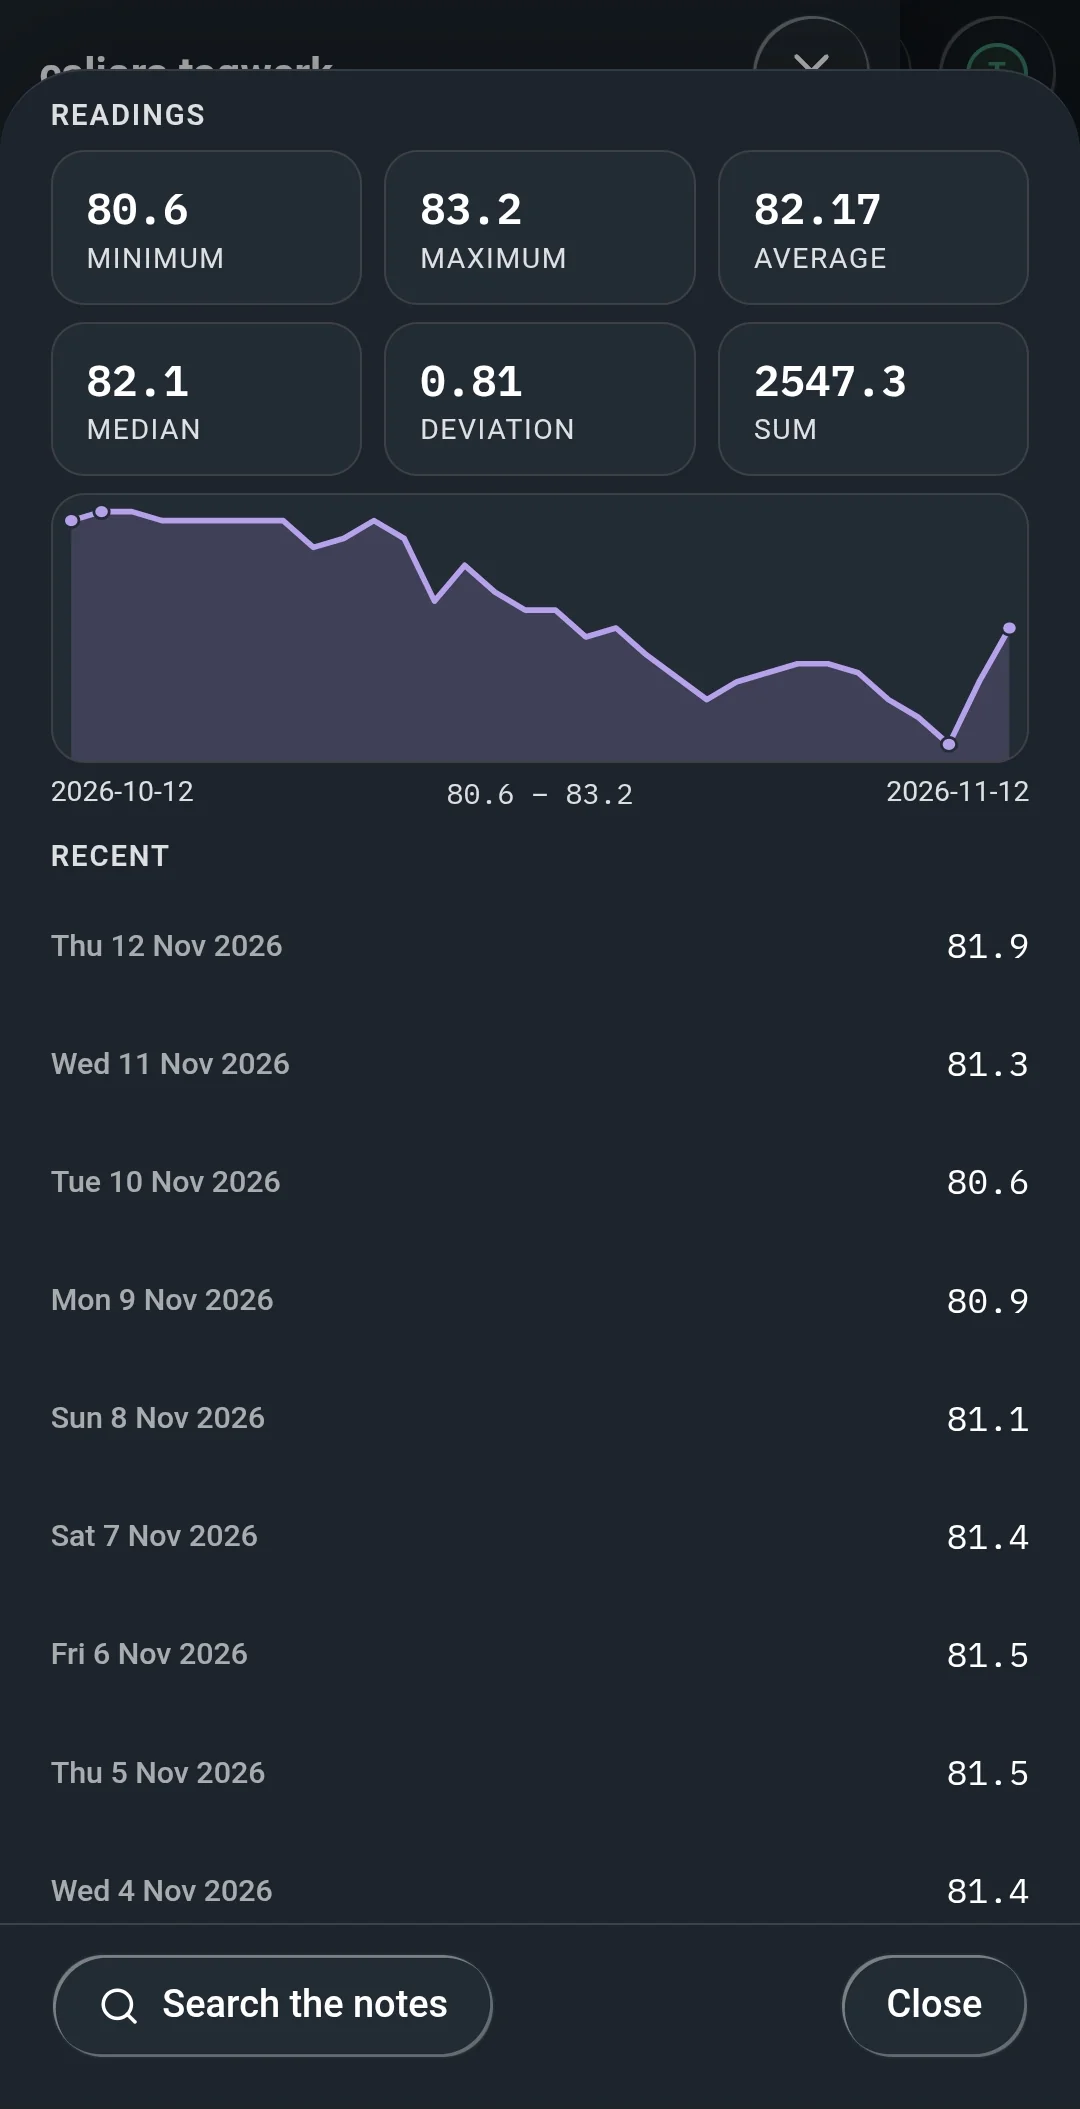
Tap the tag in the sidebar and its overview shows what the readings add up to: minimum, maximum, average, median, deviation and sum, a chart over time and the most recent values. Each value leads back to its day.
New in 1.10: when a task waits for two readings or more, for example two meters you read in one go, "Enter readings" stands beside "Done". The values go into the line and the task is marked as begun until you tick it off.
Nothing is stored outside your notes. The chart is read from your Markdown files, so the numbers are still there when you open the same files in any other editor.
Writing and entering readings is free. The statistics and the chart are part of Pro. On Linux, everything is included for free.
Get it from the Microsoft Store
Questions or ideas? Write to me, I read everything.
Tom